The purpose of this project was to develop a prototype that facilitated the encouragement of environmentally sustainable habits in a smart city.
We used an iterative approach using the simple interaction design lifecycle to guide the project and the design.
The initial requirements for the solution were based on answers from a questionnaire with 55
respondents, which asked questions about the respondents’ current environmental habits.
Through research and idea generation we came up with an application- and installation design,
which was later evaluated to compare it with our requirements.
This led to a new iteration of the design lifecycle, and additional requirements.
Throughout the project, the Fogg’s behavior model was used to ensure behavior change. The result of the project led
to the development of a self-reporting app, which showed suggestions and encouraged
sustainable habits, while an installation also showed the data from active users in the city.
to the development of a self-reporting app, which showed suggestions and encouraged
sustainable habits, while an installation also showed the data from active users in the city.
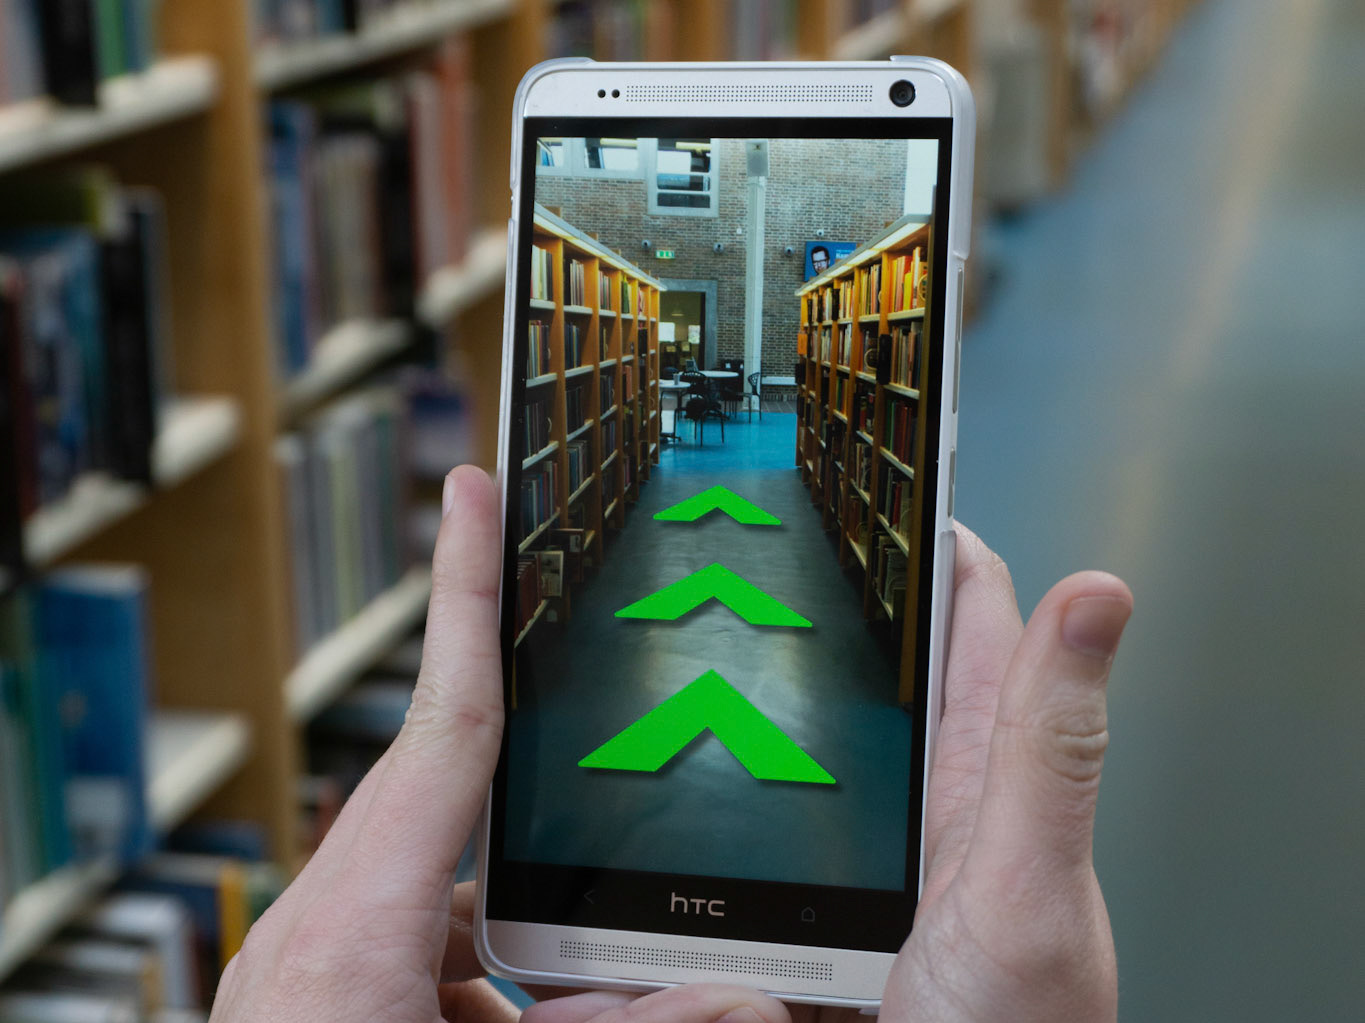
Furthermore, we use a fox as a mascot to motivate the user. This is inspired by the work of Dillahunt, et al. who used a polar bear, to encourage change in habits. This mascot is not a fixed object on the screen but will pop up to guide the user and remind them of the consequences of their actions.
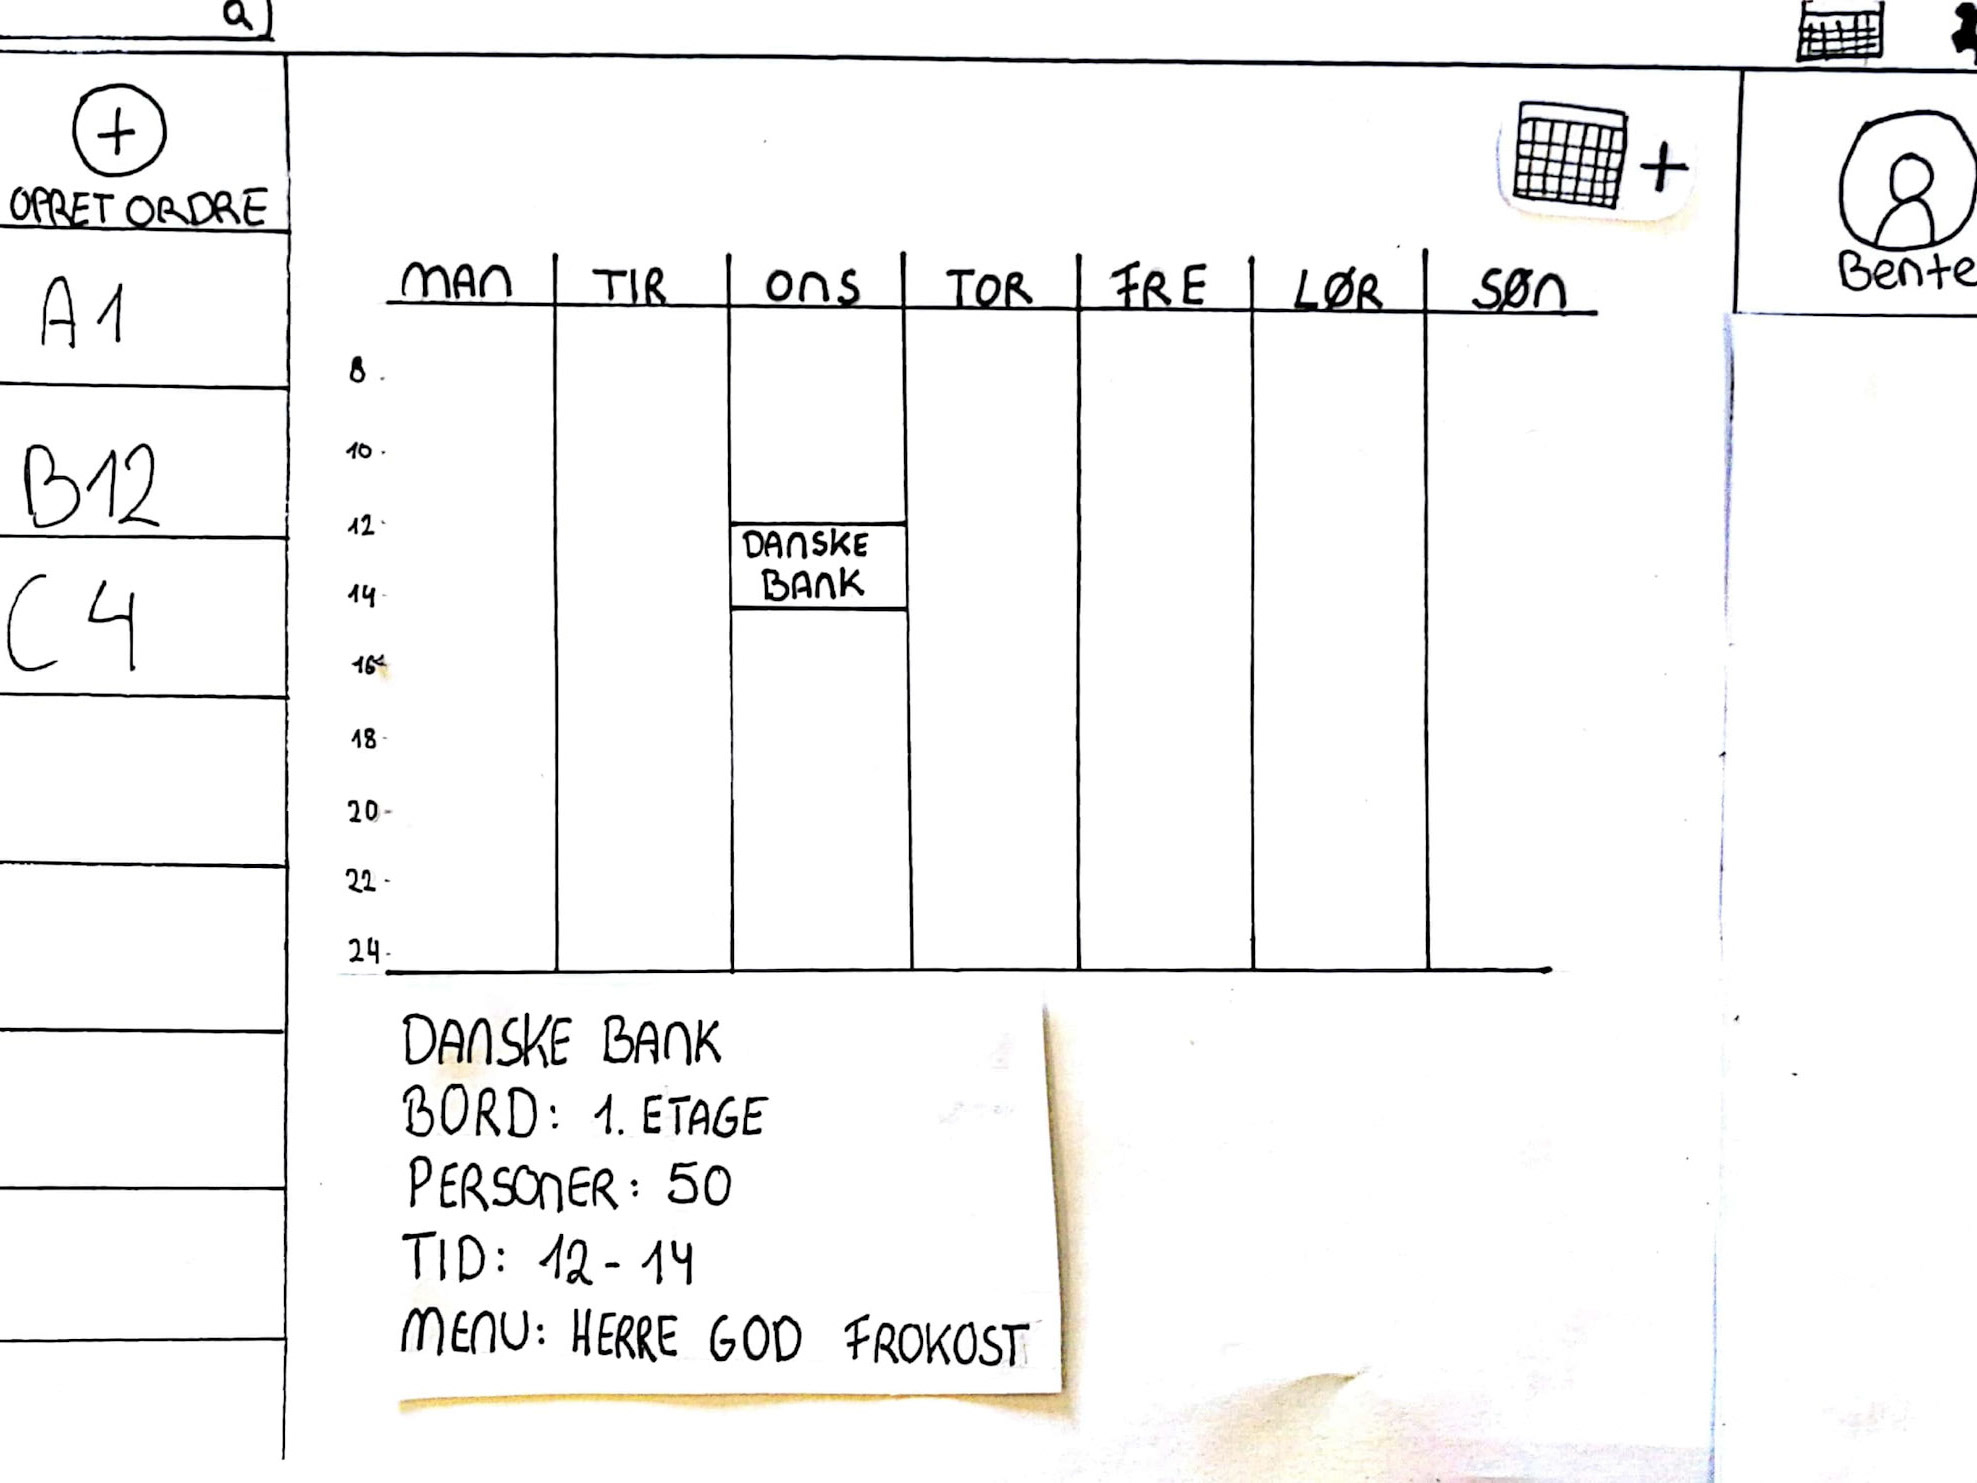
Storyboard

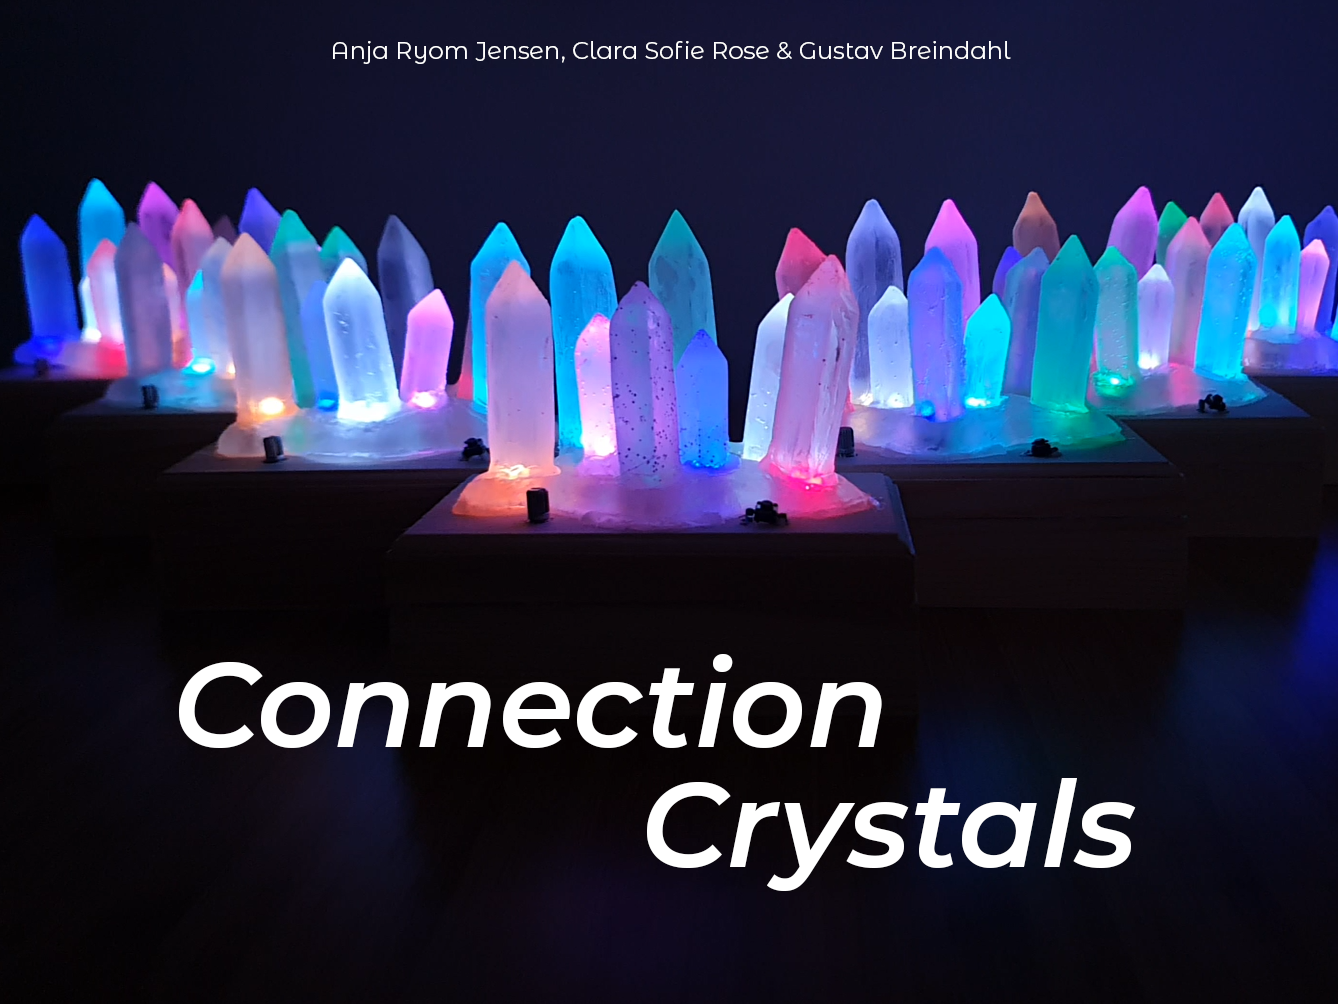
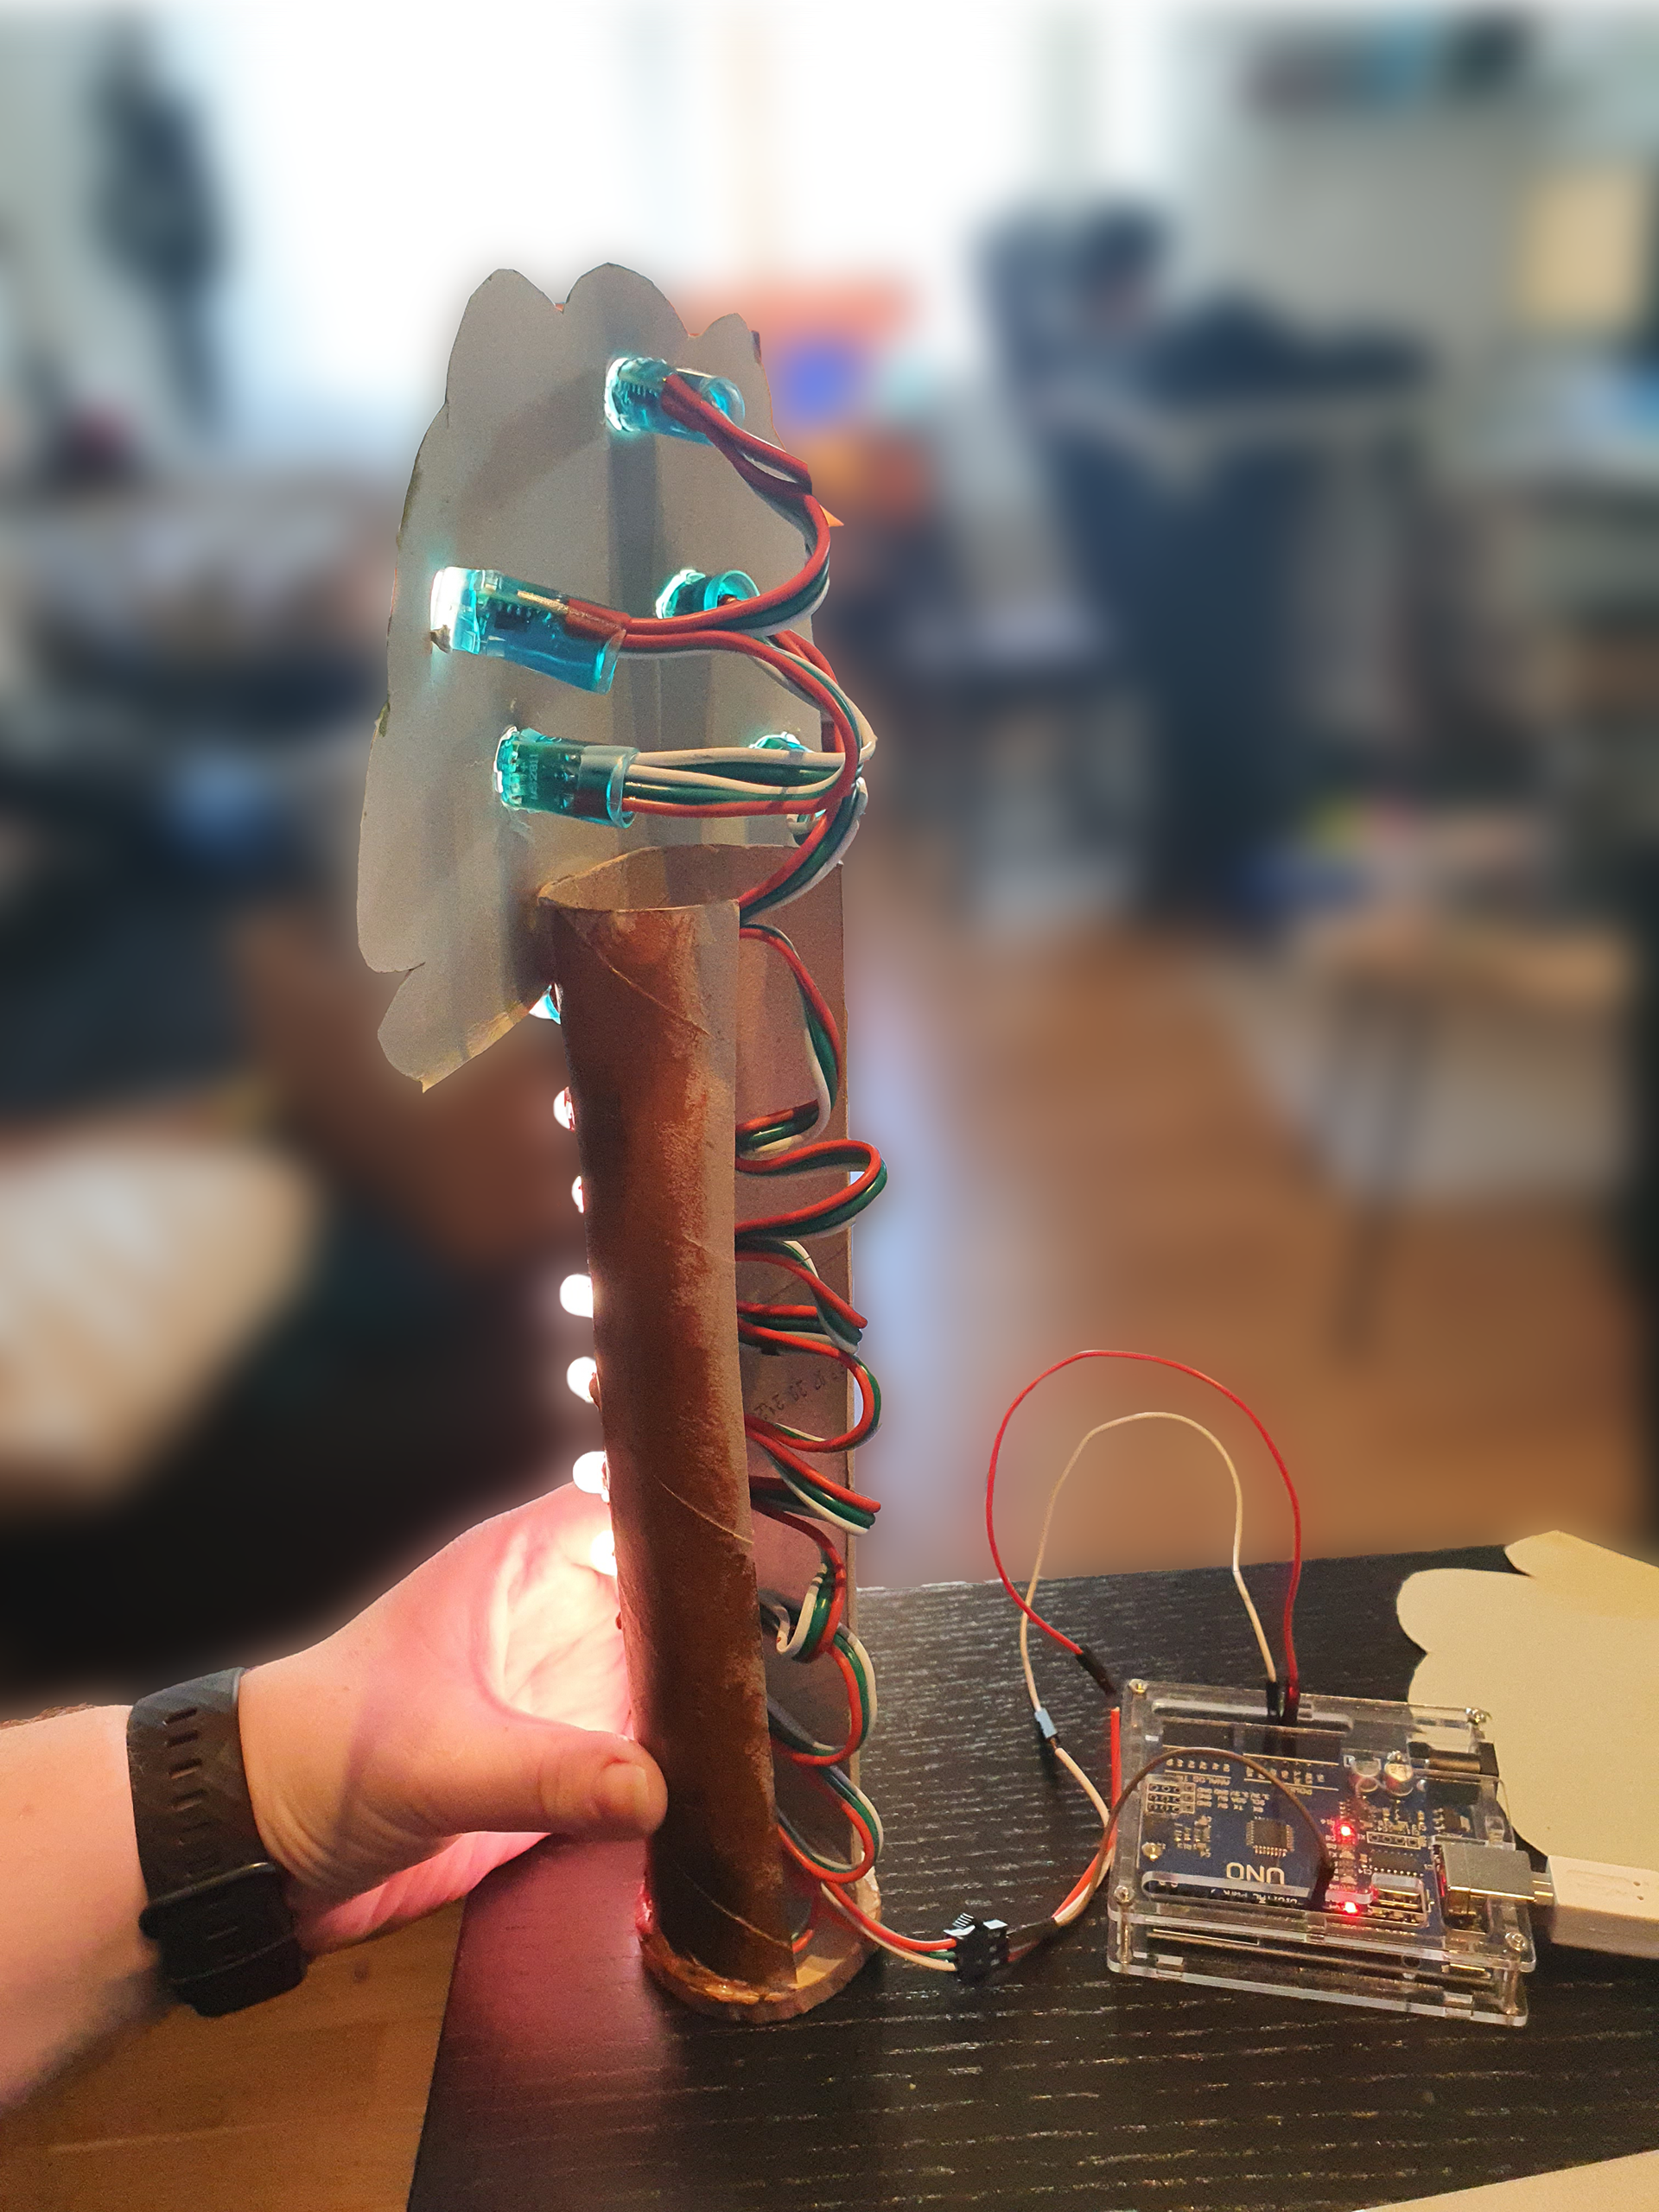
Scale model of the installation
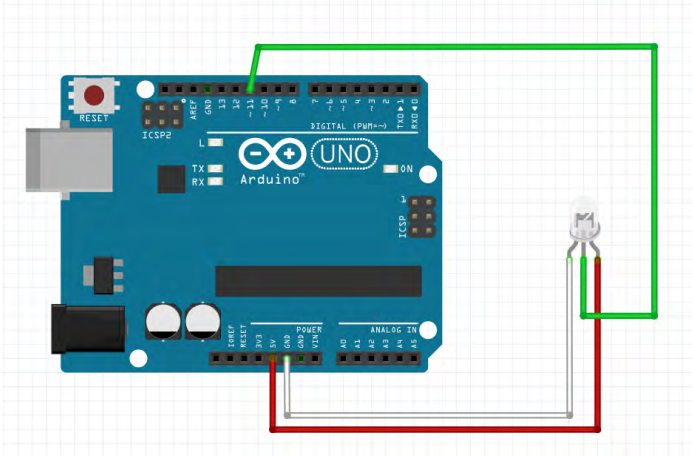
We created a physical prototype with an Arduino Uno and 15 LED's, that represents the installation that should be placed in the city. This prototype served as an artefact during the evaluation meetings with the users.
The Arduino was connected to the LED strip through
three wires. The red wire connects the LEDs to the power, 5V, the
white wire to ground, and the green wire was used to sending data
and was connected to pin 11.
three wires. The red wire connects the LEDs to the power, 5V, the
white wire to ground, and the green wire was used to sending data
and was connected to pin 11.
We made a switch case that determined the amount of LEDs lit. The first switch case set
the color of the first LED and made sure the remaining were turned
off. The line pixels.show(); turn on the LED and delay(delayval); made
a delay which is used when other LEDs need to be turned on so there
would be a delay in between.
the color of the first LED and made sure the remaining were turned
off. The line pixels.show(); turn on the LED and delay(delayval); made
a delay which is used when other LEDs need to be turned on so there
would be a delay in between.
As we had limited resources throughout this project the prototype is
made of cardboard, glue and paint.
For the stem of the tree, we started by cutting up a cardboard cylinder
and cutting holes for the lights to stick through. The tree crown was
made of this cardboard which was cut out and glued unto the stem.
After having made the silhouette we inserted the lights into the stem
and crown of the tree and made sure all lights were visible.
Hereafter, we glued a base onto the bottom of the prototype to make
it more sturdy and keep it from falling over.
To refine the look of the tree we painted it with acrylic paint. The
Arduino could now be attached to the prototype.
it more sturdy and keep it from falling over.
To refine the look of the tree we painted it with acrylic paint. The
Arduino could now be attached to the prototype.
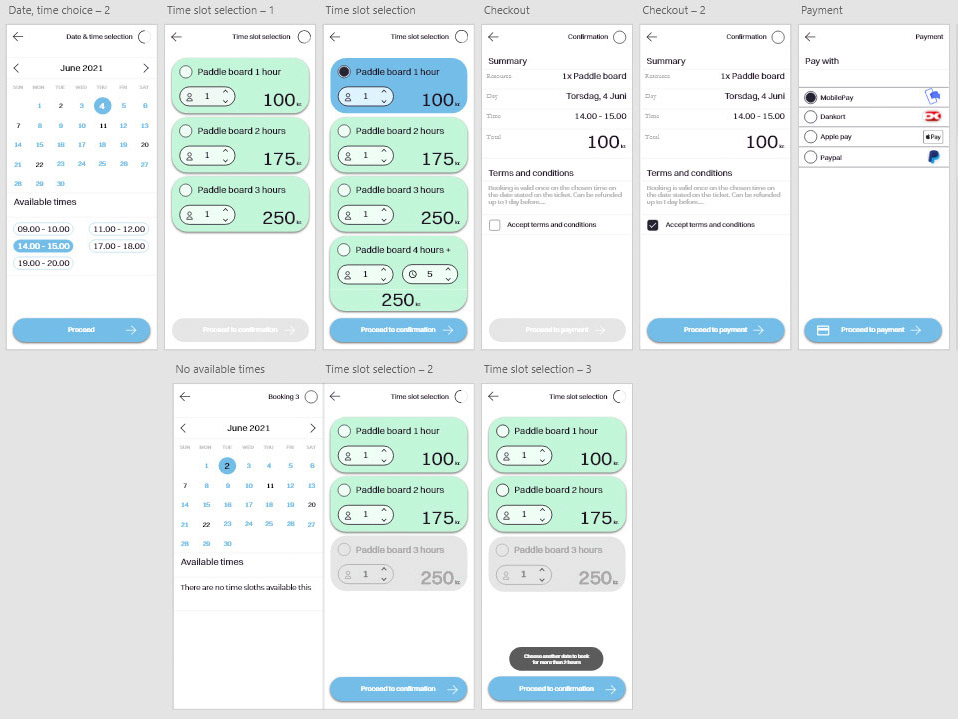
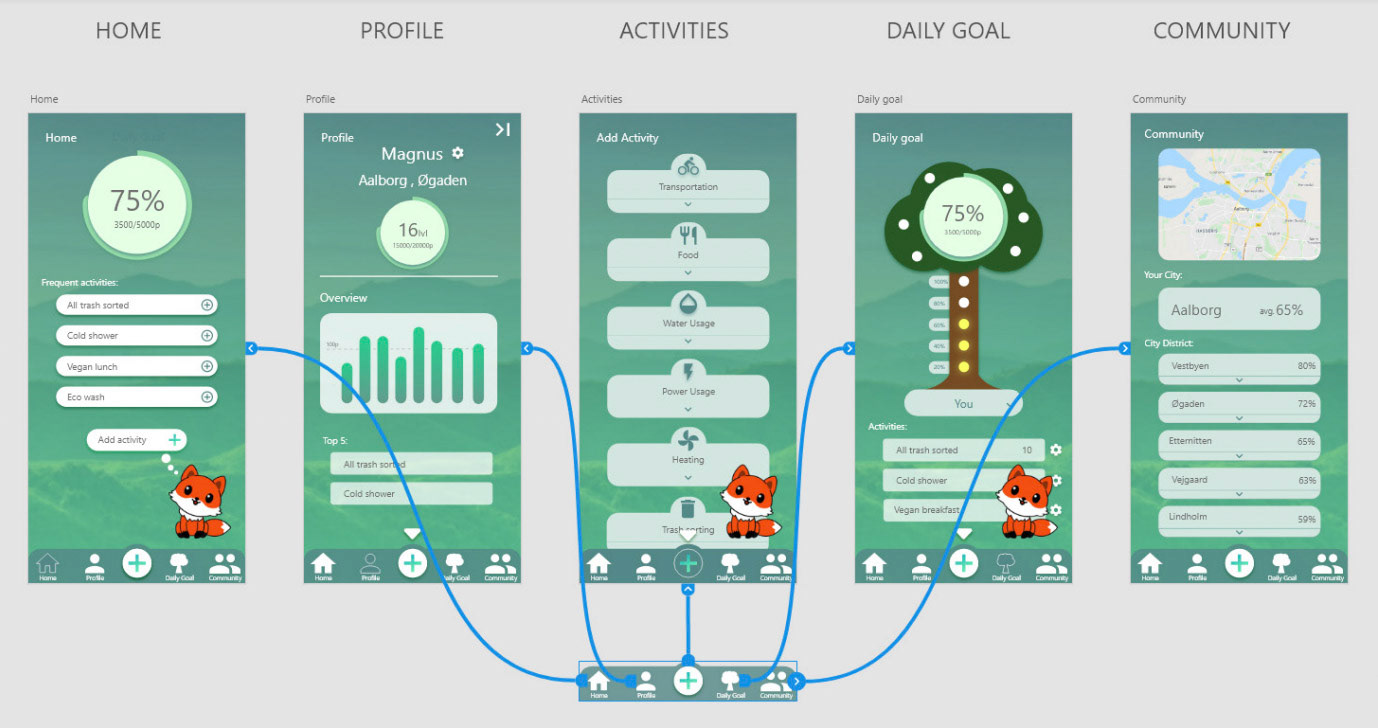
High Fidelity Prototype of the application
We used Adobe XD to create a High Fidelity prototype of the application. This application was tested with users through Microsoft teams, as this project was made during the COVID- 19 pandemic.
The home screen shows the daily progress and four frequent activities that can be added directly to their daily goal.
Below the frequent activities, there is an ‘add activity’ button which the user can click if the frequent activities are not those they are looking for. At the bottom right corner, the fox is placed.
The next screen the users will see is the ‘add activity’ page. This page is crucial for our application, as it is a main feature. Therefore, we chose to incorporate multiple tasks with activities that the users should add throughout the evaluation.
All the activities are sorted into different categories, which have a name and an icon, to give an easy overview and a descriptive name. We added an arrow to make it visible that the categories can be opened.
The last category is ‘chosen activities’ which has a different color, to separate it from the others. We chose to make the category the color of the activities when they are chosen.
Afterwards, the users can see their progress in ‘daily goal’, which is reachable through the menu. This is illustrated both on the tree trunk with the lights and in percentage in the tree crown. Below the tree is a drop-down menu, where it is possible to choose the whole city and the different districts.
At the bottom of the screen, the added activities are shown, along with the number of points that the user received for each activity. Besides the activity, there is a gear to represent ‘settings’, which was meant to be used as a way to change activity.
If the user wants to view their progress over a period of time, they can visit their profile. The profile shows the users’ name and location, which can be changed by clicking the gear icon. In the upper right corner, there is a logout button. Below the name and location, the user’s current level is shown. The level is followed by a graph that shows the user’s progress for the last week, whether they met their daily goals or not. Below the graph, their top five activities are listed and their best weekdays. At the bottom are the achievements, which are unlocked and those which are still to be earned.
The fox is sitting at the bottom right corner, to remind the user of why their progress is important.
Result
The overall concept fulfils the requirements of a smart city solution,
by giving the citizens and city government useful information about
the environmental sustainability of the city, while giving citizens
suggestions on how to improve their habits. The information is
available on the app in detail but also directly on the installation,
where progress can be seen by the number of lights turned on by
the end of each day. The data also gives citizens a chance to reflect
daily on changes to their own or the entire city’s habits, making their
decisions data-driven.